On a day-to-day basis I assist with the operations of a Citrix environment with 100+ individual XenDesktop sites (small offices). With Director, only a single site is visible at a time. I would have to select each site individually to find out if there are any failure events at a location. For 100+ sites this would be extremely tedious and time consuming. Wouldn’t it be great if there was a way to look through all unique sites and find out if there’s a failure? Heck yeah it would!
Our Solution
What I did was create a Python script that does just that. The script consumes a text file with a list of all of the XML Brokers and asks each broker “What is your
current your failure count?”. If the failure count is greater than 0 (zero), which means there’s a failure, then open up IE and navigate to that site for further investigation. The way the script is written, it will iterate and re-iterate through the list until the script is manually stopped. This way I can leave it running all day and if there’s an issue IE will pop up prompting me to login, and pause for 30 seconds.

If no issues are found at the queried XML Broker, then the script will wait 5 seconds and move to the next XML Broker in the list. If you need to manually stop the script, then use CTRL+C or just close the window where the application is being executed. When an error is found, then I can logon on to the Director server and begin troubleshooting.
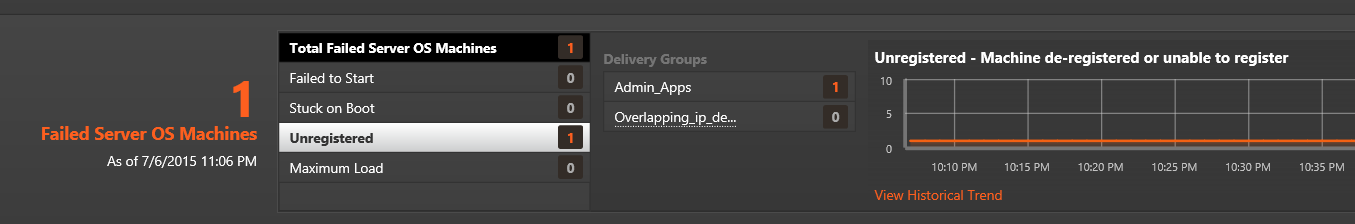
Each query is targeted at the URL “/Citrix/Monitor/OData/v2/Data/FailureLogSummaries”. The first
XML tag is what the script is looking for because it contains the current failure count. For documentation on what information is contained in this field, please visit eDocs http://support.citrix.com/proddocs/topic/xendesktop-7/cds-ms-odata-wrapper.html.
The location of the text file for me is “D:\temp\ddcFile.txt”. You may modify the variable “ddcFile” to your specific file location. The file lists DDC as such.
ddc1.mycompany.net
ddc2.mycompany.net
ddc3.mycompany.net
Here is the Python code is below.
import requests
import time
import xml.etree.ElementTree as ET
import requests.auth
from requests_ntlm import HttpNtlmAuth
import getpass
import webbrowser

#use this for username\password

username = raw_input("Enter Domain\\Username :")
password = getpass.getpass("Enter Password :")

#xml namespaces
ns = {'default': "http://www.w3.org/2005/Atom",
    'base': "http://192.168.0.112/Citrix/Monitor/OData/v2/Data/",
    'd': "http://schemas.microsoft.com/ado/2007/08/dataservices",
    'm': "http://schemas.microsoft.com/ado/2007/08/dataservices/metadata"}

#Used for automatically launching IE when a failure is detected.
ie = webbrowser.get(webbrowser.iexplore)

class DdcMonitor:
    def main(self):
        while True:
            #opens the file with the list of DDCs
            ddcFile = open('D:\\temp\\ddcFile.txt', 'r')
            for ddcFQDN in ddcFile:
                #uses HTTP. HTTPS could be added if needed.
                directorURL = "http://" + ddcFQDN.rstrip("\n") + "/Citrix/Monitor/OData/v2/Data/FailureLogSummaries"
                print("Now probing : " + str(directorURL))
                #Connection information
                #here is an example of a constructed query
                #directorURL = "http://192.168.0.112/Citrix/Monitor/OData/v2/Data/FailureLogSummaries"
                directorSession = requests.session()
                directorSession.auth = HttpNtlmAuth(username,password)
                directorReqData = directorSession.get(directorURL)

                #XML information
                root = ET.fromstring(directorReqData._content)
                entry = root.find('default:entry', ns)
                sub_1 = entry.find("default:content", ns)
                for sub_2 in sub_1.find("m:properties", ns):
                   if "FailureCount" in str(sub_2.tag):
                       if int(sub_2.text) > 0:
                           print("")
                           print("The Failure Count is increasing at " + directorURL)
                           print("The error count is currently :   " + sub_2.text)
                           print("Waiting 30 seconds")
                           ie.open('http://' + ddcFQDN + "/director")
                           print("")
                           time.sleep(30)
                       else:
                           print("The Failure Count is not increasing at " + directorURL)

                print("The probe will run again in 5 seconds")
                print("")
                print("")
                time.sleep(5)

            ddcFile.close()
            time.sleep(1)

try:
    DdcMonitor().main()
    print("the program is no longer running")
except:
    print("Something caused the program to stop. Please restart the program")
Is there any information that you would like to monitor from your Citrix deployment on an hourly, daily, or weekly basis? Let me know in the comments below.
Thanks for reading!
BC
This software / sample code is provided to you “AS IS” with no representations, warranties or conditions of any kind. You may use, modify and distribute it at your own risk.
No comments:
Post a Comment