Saturday, September 15, 2018

AWS ALB Failover with Lambda

Abstract The purpose of this article is to go over the mechanisms involved to automatically use an alternative target group for an ALB in the event an ALBs existing target group becomes unhealthy. ALB failover with Lambda Lambda is amazing for so many reasons. There are a few things that you must have in place to perform failover with an ALB.
  1. Primary Target Group
  2. Alternative Target Group
And that is about it. Everything is fairly straight forward. So let's start. I have an ALB with the following set up with the following rule set up.
 Screen Shot 2018-08-15 at 2.04.44 PM

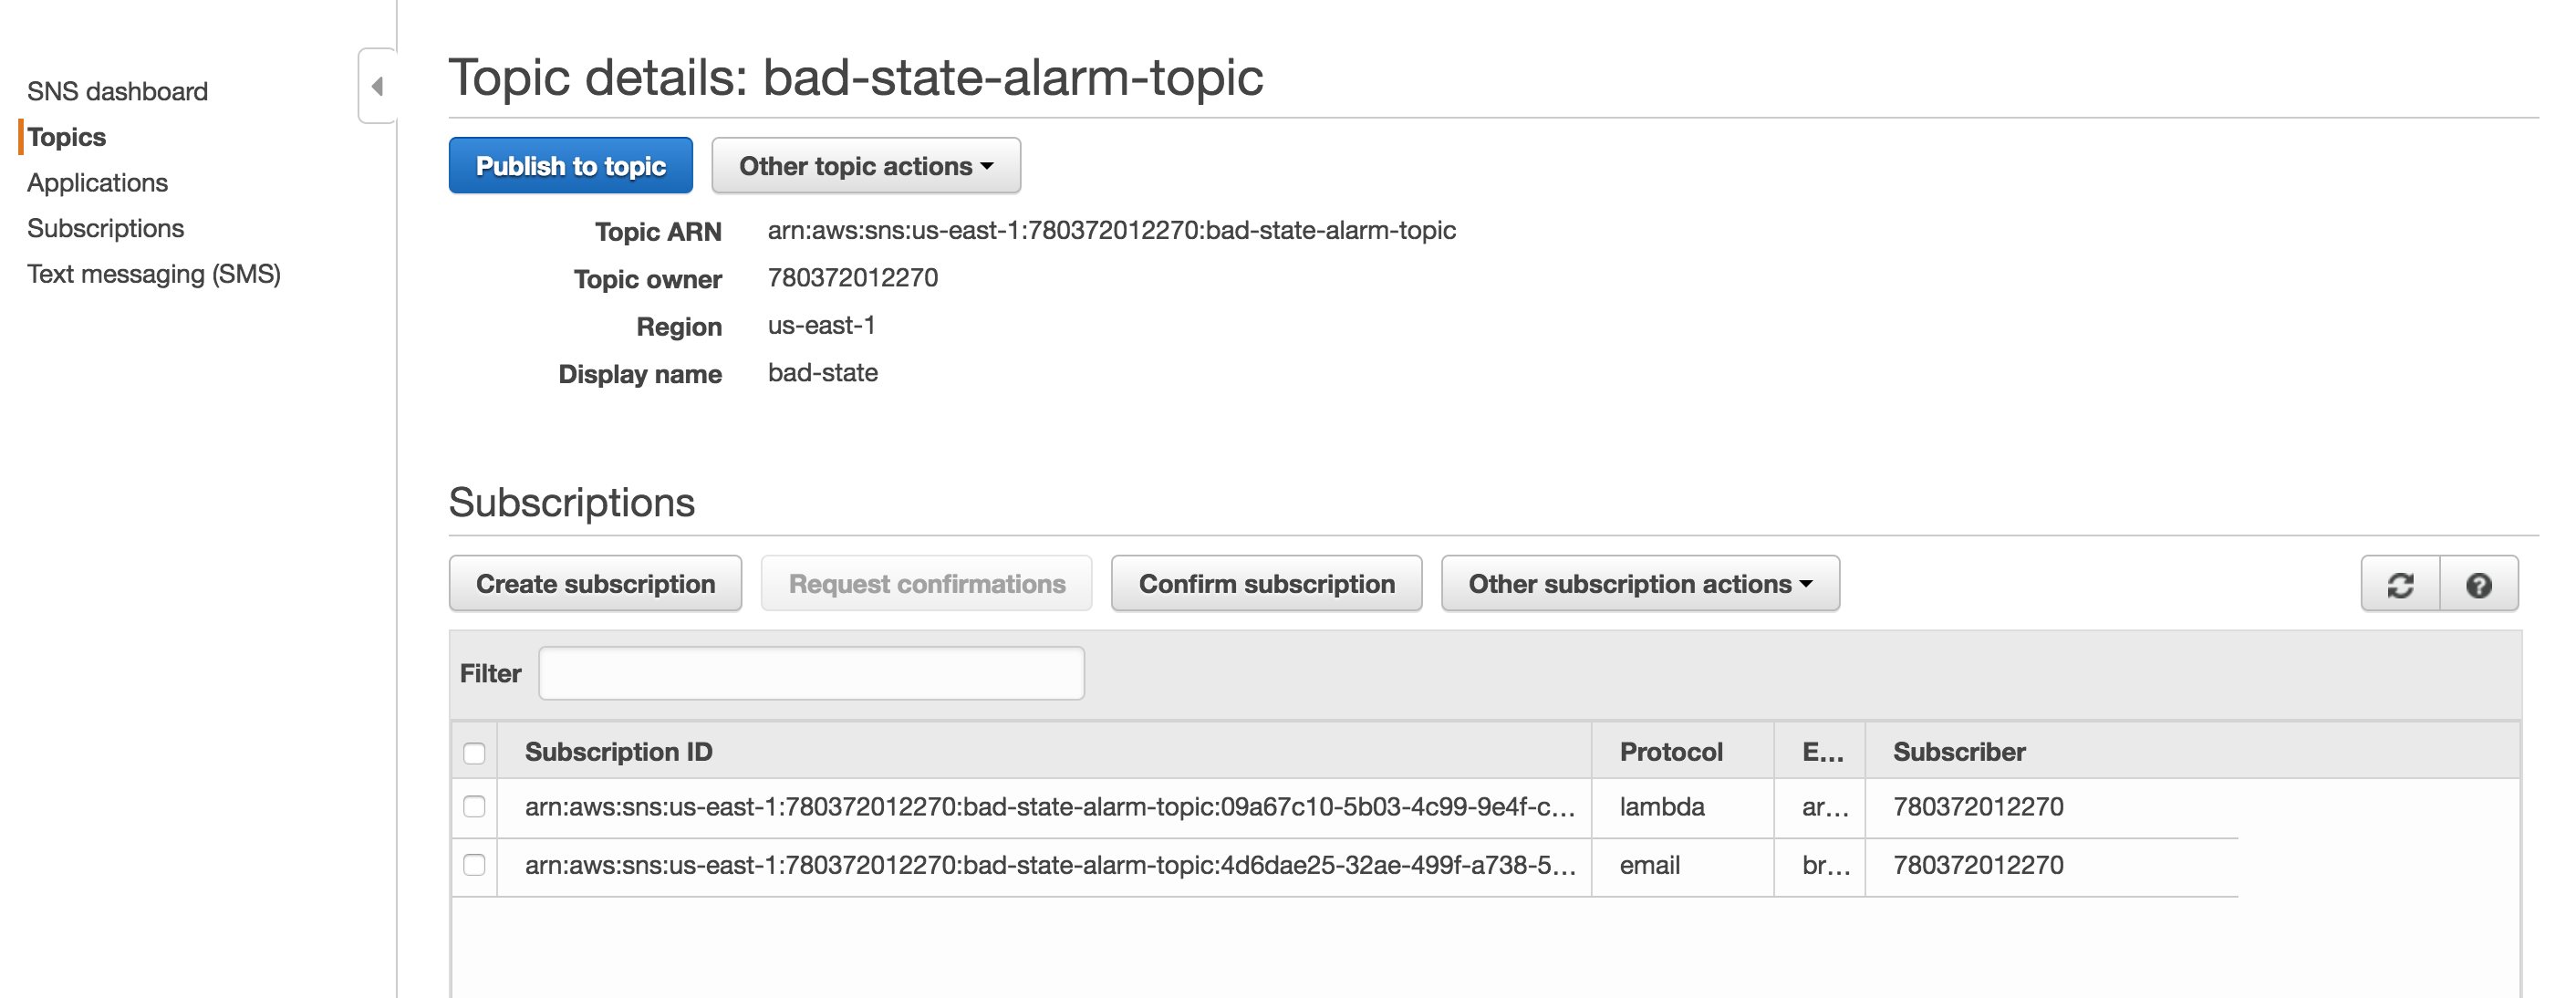
For the magic of automatic failover to occur, we need a lambda function to swap out the target groups and we something to trigger the lambda function. The trigger is going to be a Cloudwatch Alarm that sends a notification to SNS. When the SNS notification is triggered, the lambda function will run. First, you will need an SNS Topic. My screenshot already has the Lambda function already bound, but this will happen automatically as you go through the Lambda function set up. Screenshot of SNS Notification.
Screen Shot 2018-08-15 at 2.21.27 PM

Second, create a Cloudwatch alarm like the one below. Make sure to select the topic configured previously. The Cloudwatch Alarm will trigger when there are less than 1 healthy hosts. Screenshot of the Cloudwatch Alarm [gallery ids="436,437" type="rectangular"] Third, we finally get to configure the Lambda function. You must ensure that your lambda function has sufficient permissions to make updates to the ALB. Below is the JSON for an IAM role that will allow the Lambda function to make updates to any ELB.

{
"Version": "2012-10-17",
"Statement": [
{
"Sid": "VisualEditor0",
"Effect": "Allow",
"Action": "elasticloadbalancing:*",
"Resource": "*"
}
]
}

The code below is intended to be a template and is not the exact working copy. You will have to update the snippet below with the information needed to work on your site.

from __future__ import print_function

import boto3
print('Loading function')
client = boto3.client('elbv2')


def lambda_handler(event, context):
try:
response_80 = client.modify_listener(
# This is the HTTP (port 80) listener
ListenerArn = 'arn:aws:elasticloadbalancing:region:id:listener/app/alb/id/id',
DefaultActions=[
{
'Type': 'forward',
'TargetGroupArn': 'arn:aws:elasticloadbalancing:region:id:targetgroup/id/id'
},
]
)
response_443 = client.modify_listener(
# This is the HTTPS (port 443) listener
ListenerArn='arn:aws:elasticloadbalancing:region:id:listener/app/alb/id/id',
DefaultActions=[
{
'Type': 'forward',
'TargetGroupArn': 'arn:aws:elasticloadbalancing:region:id:targetgroup/id/id'
},
]
)
print(response_443)
print(response_80)
except Exception as error:
print(error)


Screenshot of Lambda function settings. Screen Shot 2018-08-15 at 2.33.56 PM


After putting it all together. When there are less than 1 health target group members associated with the ALB the alarm is triggered and the default target group will be replaced with the alternate backup member. I hope this helps!

Cheers,
BC

Troubleshooting TCP Resets (RSTs)

Inconsistent issues are by far the most difficult to track down. Network inconsistencies are particularly problematic because there can often be many different devices that must be looked into in order to identify the root cause. The following troubleshooting goes through a couple of steps. The first part is to start a tcpdump process that will record TCP RSTs. Then you can send a lot of HTTP requests. Below is the command to issue the tcpdump and fork the process to the background. However, the output will still be sent to the active terminal session because of the trailing &.

sudo tcpdump -i any -n -c 9999 -v 'tcp[tcpflags] & (tcp-rst) != 0 and host www.somesite.com' &

Below is the command to issue lots of HTTP requests. The important part to understand about the below command is to go through the TCP build up and tear down that happens during the HTTP request process.

for i in {1..10000}; do curl -ks https://www.somesite.com/robots.txt > /dev/null ; done

Below is an example of what a potential output could be.

17:16:56.916510 IP (tos 0x0, ttl 62, id 53247, offset 0, flags [none], proto TCP (6), length 40)
10.1.1.1.443 > 192.168.5.5.41015: Flags [R], cksum 0x56b8 (correct), seq 3221469453, win 4425, length 0
17:17:19.683782 IP (tos 0x0, ttl 252, id 59425, offset 0, flags [DF], proto TCP (6), length 101)
10.1.1.1.443 > 192.168.5.5.41015: Flags [R.], cksum 0x564b (correct), seq 3221469453:3221469514, ack 424160941, win 0, length 61 [RST+ BIG-IP: [0x2409a71:704] Flow e]
17:18:54.484701 IP (tos 0x0, ttl 62, id 53247, offset 0, flags [none], proto TCP (6), length 40)
10.1.1.1.443 > 192.168.5.5.41127: Flags [R], cksum 0x46f7 (correct), seq 4198665759, win 4425, length 0

While it may be unclear exactly why the TCP RSTs are happening this does provide a mechanism to reproduce TCP RSTs behaviors to investigate on other devices in the Network traffic flow. Below is documentation on how to troubleshoot TCP RSTs for the F5. 

https://support.f5.com/csp/article/K13223

 Happy troubleshooting!

Grabbing AWS CloudFront IPs with curl and jq

There's times when you want to restrict access to your infrastructure behind CloudFront so that requests must go through the CloudFront CDN instead of your origin directly. Fortunately, AWS lists their public IP ranges in a JSON format in the following link, https://ip-ranges.amazonaws.com/ip-ranges.json. However, there are a lot of services in the above link and it would be very tedious to take the entire JSON and read through it to grab specific CloudFront IP's. Using the combination of command line tools curl and jq we can easily grab just the CloudFront IP ranges to lock down whatever origin that exists. Below is the command that I've used to grab just the CloudFront IP's. Enjoy!

curl https://ip-ranges.amazonaws.com/ip-ranges.json | jq '.prefixes | .[] | select(.service == "CLOUDFRONT") | .ip_prefix'

BC

Decrypt all PFX files in a directory

I recently received a whole bunch of different PFXs where I needed to decrypt the files, extract the keys, and extract the server certificate. Below is Bash script to do just that. Replace the bolded somepass with the real password used to decrypt the PFX and execute the script in the directory with all of the PFX files. Note, the script would only work if the PFX's all have the same password. Enjoy!

for f in *.pfx; 
do 
 pemout="${f}.pem"; 
 keyout="${pemout}.key";
 crtout="${pemout}.crt";
 openssl pkcs12 -in $f -out $pemout -nodes -password pass:somepass; 
 openssl rsa -in $pemout -out $keyout;
 openssl x509 -in $pemout -out $crtout;
done

BC

Demystifying the NGINX Real IP Module

The Real IP module within NGINX is very strict. The purpose of this post is to go over how the NGINX's real_ip_from works by walking through a few examples. Below is the official NGINX document. http://nginx.org/en/docs/http/ngx_http_realip_module.html

Example 1

NGINX configuration.
 set_real_ip_from 0.0.0.0/0 ;
 real_ip_recursive on ;
 real_ip_header x-forwarded-for ;

Source and Destination IP
 src IP = 10.0.0.2
 dst IP = 10.0.0.3

Request
 GET /someurl.html HTTP/1.1
 host: brookscunningham.com
 X-Forwarded-For: 1.1.1.1, 2.2.2.2, 3.3.3.3, 4.4.4.4

The IP 1.1.1.1 would be utilized for the real client IP based on the above request.

Example 2

NGINX configuration. Same configuration as above. Source and Destination IP
 src IP = 10.0.0.2
 dst IP = 10.0.0.3

Request
 GET /someurl.html HTTP/1.1
 host: brookscunnningham.com

The X-Forwarded-For header is missing. NGINX will utilize the layer 3 source IP as the client IP. In this case NGINX will utilize the IP 10.0.0.2 as the real IP.

Example 3

Now lets get tricky and lock down the Real IP Module to a subset of IP's. NGINX Config
set_real_ip_from 10.0.0.0/8 ;
real_ip_recursive on ;
real_ip_header x-forwarded-for ;

Source and Destination IP
src IP = 10.0.0.2
dst IP = 10.0.0.3

HTTP Request
 GET /someurl.html HTTP/1.1
 host: brookscunningham.com
 X-Forwarded-For: 1.1.1.1, 2.2.2.2, 3.3.3.3, 4.4.4.4

NGINX would use the IP 4.4.4.4 as the real client IP in the above request. The reason for this is that NGINX will trust the last IP in the chain of trusted IP's in the designated real IP header.

Example 4

NGINX Config
set_real_ip_from 10.0.0.0/8 ;
set_real_ip_from 4.4.4.4 ;
real_ip_recursive on ;
real_ip_header x-forwarded-for ;

Source and Destination IP
src IP = 10.0.0.2
dst IP = 10.0.0.3

HTTP Request
 GET /someurl.html HTTP/1.1
 host: brookscunningham.com
 X-Forwarded-For: 1.1.1.1, 2.2.2.2, 3.3.3.3, 4.4.4.4

NGINX would use the IP 3.3.3.3 as the real IP since that is 10.0.0.0/8 is trusted and 4.4.4.4 is the last IP in the chain of trusted IP's.

Example 5

NGINX Config
set_real_ip_from 10.0.0.0/8 ;
set_real_ip_from 4.4.4.4 ;
real_ip_recursive off ;
real_ip_header x-forwarded-for ;
Source and Destination IP
src IP = 10.0.0.2
dst IP = 10.0.0.3

HTTP Request
 GET /someurl.html HTTP/1.1
 host: brookscunningham.com
 X-Forwarded-For: 1.1.1.1, 2.2.2.2, 3.3.3.3, 4.4.4.4

NGINX would use the IP 4.4.4.4 as the real IP since the real_ip_recursive is set to off. Only the last IP in the chain of X-Forwarded-For would be utilized for the client IP.  

Example 6 - Internet IPs as source IP

NGINX Config
set_real_ip_from 10.0.0.0/8 ;
set_real_ip_from 4.4.4.4 ;
real_ip_recursive off ;
real_ip_header x-forwarded-for ;

Source and Destination IP
src IP = 55.55.55.55
dst IP = 10.0.0.3

HTTP Request
 GET /someurl.html HTTP/1.1
 host: brookscunningham.com
 X-Forwarded-For: 1.1.1.1, 2.2.2.2, 3.3.3.3, 4.4.4.4

NGINX would 55.55.55.55 as the real client IP. The reason for this is because the source IP address is not defined as trusted within the set_real_ip_from.

Example 7

NGINX Config
set_real_ip_from 10.0.0.0/8 ;
set_real_ip_from 4.4.4.4 ;
set_real_ip_from 55.55.55.55 ;
real_ip_recursive on ;
real_ip_header x-forwarded-for ;

Source and Destination IP
src IP = 55.55.55.55
dst IP = 10.0.0.3

HTTP Request
 GET /someurl.html HTTP/1.1
 host: brookscunningham.com
 X-Forwarded-For: 1.1.1.1, 2.2.2.2, 3.3.3.3, 4.4.4.4

NGINX would 3.3.3.3 as the real client IP. The reason for this is because real_ip_recursive is set to on and the source IP address is now defined as trusted within the set_real_ip_from up to 4.4.4.4.

Remote Wireshark and tcpdump

This may come to a surprise to many people, but sometimes computers do not talk to each other the correctly. Luckily, packets don't lie. We can easily find out which computer is not communicating properly using either tcpdump and/or Wireshark. Below are by far the 2 most useful network analysis commands that I use.

Print only the HTTP header information

The following command is usefully when you only need to look at the HTTP headers, provided you are analyzing cleartext HTTP traffic.
sudo tcpdump -i any -A -s 10240 '(port 80) and (((ip[2:2] - ((ip[0]&0xf)<<2)) - ((tcp[12]&0xf0)>>2)) != 0)' and not host 127.0.0.1 | egrep --line-buffered "^........(GET |HTTP\/|POST |HEAD )|^[A-Za-z0-9-]+: " | sed -r 's/^........(GET |HTTP\/|POST |HEAD )/\n\1/g'

Wireshark to a remote host

For more in-depth protocol analysis, it may be necessary to leverage Wireshark. The command below is super useful to pipe the tcpdump output from a remote machine to your local instantiation of Wireshark. This way you don't have to take a capture, save it locally, and then open up Wireshark. Below is the command that is needed.
ssh ubuntu@ -p 22 -i ~/sshpemkeyauth.key "sudo tcpdump -s 0 -U -n -w - -i any not port 22" | wireshark -k -i - &
You can make it into a bash function like I have below as well.
function wiresh {
 ssh ubuntu@$1 -p 22 -i ~/sshpemkeyauth.key "sudo tcpdump -s 0 -U -n -w - -i any not port 22" | wireshark -k -i - &
 }
This way you only have to do the following at the command line to take a remote wireshark capture:
wiresh 
I hope this helps anyone else out there. I have to give a shout out to StackOverflow for inspiring this post. BC

Basecamp 2 RSS Feed and Slack Integration

Abstract

The purpose of this post is to demonstrate how Basecamp updates can be automatically pulled into a Slack channel.

Pre-reqs

Before going any further, the following assumptions must be satisfied.
  1. IFTTT must be integrated into your Slack team.
  2. The Slack channel that will receive the Basecamp updates must be a public Slack channel.

Identify the Problem

Slack and Basecamp are both awesome tools in their own right, and both have a distinct purpose for successful project execution. Slack is great for real time troubleshooting and communication when a conference call is not necessary. Whereas Basecamp is great for task management and big picture tracking. What I have found while using both tools independently is that Basecamp can quickly be forgotten in favor of strictly Slack and email communication. This is typically a non-issue for small projects with very few moving parts, but as projects become larger with more teams involved it becomes even more important to keep track of tasks independently through Basecamp. To keep everyone on track and focused on their respective tasks the two tools need to be merged.

Fix the Problem

The solution to this problem is to pull Basecamp updates into Slack by using IFTTT (https://ifttt.com/). Basecamp 2 supports RSS feeds that are automatically updated when something new happens within a Basecamp project. See the link below for details.

https://basecamp.com/help/2/guides/projects/progress#rss-feeds

IFTTT can be used to pull updates from RSS feeds and post new updates into Basecamp. The link below will take you right to the If This portion of the IFTTT applet.

https://ifttt.com/create/if-new-feed-item?sid=3

Now here is where authentication comes into play and things are a bit trickier as the following links from StackOverflow will articulate.

http://stackoverflow.com/questions/2100979/how-to-authenticate-an-rss-feed

http://stackoverflow.com/questions/920003/is-it-possible-to-use-authentication-in-rss-feeds-using-php

A lot of RSS feeds are accessed via an unauthenticated means. However, Basecamp (thankfully) protects project RSS feeds so that not just anybody can view your project details. To authenticate against an RSS feed, the URL must be constructed in the following manner.

https://username:password@basecamp.com//projects/.atom

The  and  pieces of the above URL will be specific to your specific Basecamp identifiers. The username and password will be your username and password that you can use to access Basecamp. Since this is a URL that is used to access the RSS feed, then your username may need to be modified. I'll use the following email as an example.

zergrush@allyourbase.com

The ampersand (@) must be URL encoded when used for the RSS feed. The following is example of a properly constructed Basecamp URL.

https://zergrush%40allyourbase.com:password1234@basecamp.com/9999999/projects/99999999.atom

You can validate that the URL should work by copy/pasting it in your browser. If you do not see an RSS feed, then check to make sure that any other special characters in your username or password are encoded properly. Below is my favorite site for URL encoding and decoding.

http://meyerweb.com/eric/tools/dencoder/

If IFTTT accepts the RSS feed URL, then  congrats! The hard part is over. You can then select Slack for the Then That action and use the Post to Channel option. One thing to note, is that the Slack channel must be a public channel for this integration to work. You can also customize how the RSS message is sent to Slack within the IFTTT settings. That's all there is to it. Test by doing anything on the Basecamp project associated with the RSS feed you configured, and then Slack should reflect the update in about 5 - 10 min. I hope anyone reading has found this article beneficial. Let me know in the comments below if you have any questions! Thanks, Brooks

How to use Mitmproxy and Ettercap together on OS X El Capitan

Abstract.

The purpose of this document is to provide guidance on how to configure both of the tools mitmproxy and ettercap to work together to monitor mobile application traffic. This document is intended for educational purposes. Using the techniques here with malicious intent may result in criminal consequences. Before going any further, I want to  point out one of the better quotes that I have seen in a man file :-). Below can be found in the man file of ettercap.

"Programming  today  is  a  race between software engineers striving to build bigger and better idiot-proof programs, and the Universe trying to produce bigger and better idiots. So far, the Universe is winning." - Rich Cook

Install ettercap

Homebrew is amazing. Ettercap is as easy to install as issuing the following command.

brew install ettercap

Install mitmproxy

The docs for mitmproxy are fairly straightforward. Mitmproxy is a python package that runs on Python 2.7. The link below has the official documentation. http://docs.mitmproxy.org/en/latest/install.html#installation-on-mac-os-x

Configure Port Forwarding

First enable IP forwarding. This is outlined in the transparent proxy guide in the following link,. http://docs.mitmproxy.org/en/latest/transparent/osx.html.

sudo sysctl -w net.inet.ip.forwarding=1

Brian John does an excellent job explaining the new port configuration that needs to occur for OS X Mountain Lion. See the link below for his guide. http://blog.brianjohn.com/forwarding-ports-in-os-x-el-capitan.html I will go through the steps necessary for mitmproxy to work as expected based on the information that Brian John provided.

Create the anchor file.

/etc/pf.anchors/mitm.pf

Add the following lines to the anchor file, mitm.pf.

rdr pass on en0 inet proto tcp from any to any port 80 -> 127.0.0.1 port 8080

rdr pass on en0 inet proto tcp from any to any port 443 -> 127.0.0.1 port 8080

Create the pfctl config file.

/etc/pf-mitm.conf

Add the following lines to the pfctl config file.

rdr-anchor "forwarding" load anchor "forwarding" from "/etc/pf.anchors/mitm.pf"

Enable or Disable Port Forwarding.

To activate or deactivate port forwarding, use one of the following commands.

Enable.

sudo pfctl -ef /etc/pf-mitm.conf

Disable.

sudo pfctl -df /etc/pf-mitm.conf

Combining the tools.

Now that port forwarding is now configured, fire up mitmproxy with the following command.

python2.7 mitmproxy -T --host

mitmproxy will by default listen for incoming HTTP and HTTPS traffic on the proxy port 8080. Next, use the following command to start ARP spoofing the target device.

sudo ettercap -T -M arp:remote ///80,443/ ////

The final command should look something like the following.

sudo ettercap -T -M arp:remote /192.168.0.1//80,443/ /192.168.1.54///

You will need to trust the mitmproxy CA if you would like to inspect HTTPS traffic. The steps for this configuration can be found in the following link, http://docs.mitmproxy.org/en/latest/certinstall.html.   Once mitmproxy and ettercap are both running, then you should be start seeing network traffic from your mobile device on your OS X device. Good Luck with inspecting traffic! Let us know in the comments below if you have any questions or feedback on this article. Brooks  

No Private Key, No Problem. How to Decrypt SSL/TLS traffic with Session Keys.

The purpose of the paper is to provide a guide on how to decrypt SSL/TLS traffic without a private key.

There are many times when IT admins need to utilize a packet inspection such as Wireshark. When the application data is encrypted however, troubleshooting application data becomes more of a challenge. The easiest way to decrypt data is to use the private key for the corresponding public key. Wireshark provides another means for decrypting data as well by using the pre-master secret. I will not dive into the intricacies of why this can be used to decrypt data because that part of cryptology is an entirely separate topic. For an in-depth explanation see http://www.moserware.com/2009/06/first-few-milliseconds-of-https.html. Now let’s dive in.

Step 1.

The first thing you will need to do is configure an environment variable (Windows 7). Right click on My Computer –> Properties –> Advanced System Settings. In the Advanced Tab click Environment Variables.

wiresharkdecrypt_01  

Step 2.

Under the System variables, click New. You will add the System variable SSLKEYLOGFILE. Create a path from the variable ending with premaster.txt. See the image below for more details.

wiresharkdecrypt_02

Step 3.

Once this is set, we will point Wireshark to the premaster file by navigating to Edit –> Preferences –> Protocols –>SSL(Pre)-Master-Secret log filename. Click browse and select the premaster.txt file we created earlier. You will need to generate some encrypted traffic via Firefox or Chrome before the file will show up. Internet Explorer will not work for decrypting data using this method.

  wiresharkdecrypt_03

Step 4.

Any new network traces taken through Wireshark while navigating SSL/TLS encrypted sites that leverage a premaster secret and RSA will now be decrypted. A trace can also be taken from a NetScaler appliance, and then decrypted for a specific client utilizing the SSLKEYLOGFILE Environment Variable. For information on sharing a trace without distributing a private key, please see http://support.citrix.com/article/CTX135889.

wiresharkdecrypt_04

I’d like to give special credit to the author of the article below for inspiring this article.

http://www.root9.net/2012/11/ssl-decryption-with-wireshark-private.html

Happy Decrypting!

BC

Resilient Storefront Optimal Gateway Routing with GSLB

Pre-Requisites Before reading further, if you don’t know what StoreFront Optimal Gateway Routing (OGR) is, STOP and check out: If you need a refresher on DNS or NetScaler GSLB, then STOP and review eDocs and relevant CTX article and resources. For information on NetScaler GSLB, see the links below: And if you want to see how DNS works in your own environment, then check out one of my favorite ways to tools to troubleshoot and learn about DNS with http://digwebinterface.com/. Try resolving your own site with the “trace” option checked and unchecked. Abstract The purpose of this blog is provide an overview on how GSLB can be used to provide a redundant solution with StoreFront Optimal Gateway Routing (OGR). A few questions will be answered in this blog for a multi-datacenter design.
  1. How can we use a single URL for external access?
  2. How can we send users to specific datacenter where users’ unique data or backend application dependencies reside?
  3. How can we deploy a resilient solution to protect against a datacenter outage?
Let’s get into it Acme is our example customer. Acme has three (3) datacenters, NY, LA, and Atlanta (ATL). User’s on the East coast have non-persistent desktops, but have their roaming profile on a file server at NY. User’s on the West coast have non-persistent desktops, but have their roaming profile on a file server at LA. All users have access to a unique application that has backend requirements at the ATL datacenter. So the answer to question number one is fairly straight forward. Use GSLB with NetScaler Gateway. The common external FQDN can be “access.acme.com”. Three (3) NetScaler Gateway VIPs will reside at each datacenter and will be included in the GSLB configuration. If we didn’t care where we sent users, then we could stop here. However, with the scenario outlined above, we want to avoid scenario where a NY user (user data is in NY) launches a desktop that is proxied by the LA Datacenter. This user would then have their Citrix session go from client’s locations –> LA NetScaler Gateway –> NY datacenter, which is certainly not the optimal route. More importantly this routing will utilize precious private site-to-site bandwidth and could be detrimental to a user’s experience. This is where OGR comes into play. Let’s answer question #2. How can we send users to a specific datacenter where their unique data or backend application dependencies reside? We want to use site prefixes to make each site unique. For those of you already thinking ahead, yes, a SAN certificate is required for this solution. Below are the prefixes we will use for the example:
  • NY NetScaler Gateway VIP = ny.access.acme.com
  • LA NetScaler Gateway VIP = la.access.acme.com
  • ATL NetScaler Gateway VIP = atl.access.acme.com
With OGR and under normal work conditions we can direct users accessing a XD Site at NY will be proxied by the NY NSG (ny.access.acme.com), users accessing a XD Site at LA will be proxied by the LA NSG (la.access.acme.com), and users accessing the unique application (AutoCAD) will be proxied by the ATL NSG (atl.access.acme.com). With this solution, users are able to authenticate at any site and launch applications that will utilize the public WAN to cross the nation, instead of using potentially costly MPLS connections. How are users able to authenticate at NY, but still able to launch apps from ATL? Using STAs of course! All NetScaler appliances in the environment will need to be able to communicate with all of the same STAs. For information on STAs, please see: http://support.citrix.com/article/CTX101997. With this configuration, authentication and application enumeration are separate events from application launch. It is key to understand that fact. Authentication can occur anywhere, but application launch is more granularly specified with unique site prefixes and OGR. So let’s answer question # 3 and add some resiliency. How can we deploy a resilient solution to protect against a datacenter internet outage? What happens when a construction company’s backhoe accidently severs Acme’s internet POP in LA while laying down city infrastructure, but Acme’s MPLS connection remains intact? A unique GSLB vServer exists for each of the site unique prefixes. A separate GSLB vServer also exists for “access.acme.com”. Configuring the “access.acme.com” vServer as a backup vServer for all of the GSLB vServers with the site prefix will protect the individual and unique FQDNs against a datacenter failure. For example, when the LA datacenter’s internet connection is broken, the NetScaler appliances at NY and ATL will recognize an outage via either MEP or explicit health monitors. Users are then sent to the available NY and ATL NSG when resolving “la.access.acme.com” and “access.acme.com”. Users can then be proxied through the internal MPLS via the available sites. If the MPLS (or other private site to site connection) went down, then StoreFront can be configured with DR (http://support.citrix.com/proddocs/topic/dws-storefront-26/dws-configure-ha-lb.html), but we will save that talk for another day ;-). I have included some diagrams to help clarify things. A key things to keep in mind is that authentication and application launch are two completely separate events and workflow. The diagram below is for the authentication and application enumeration workflow.   Blog_Auth_Workflow_01   
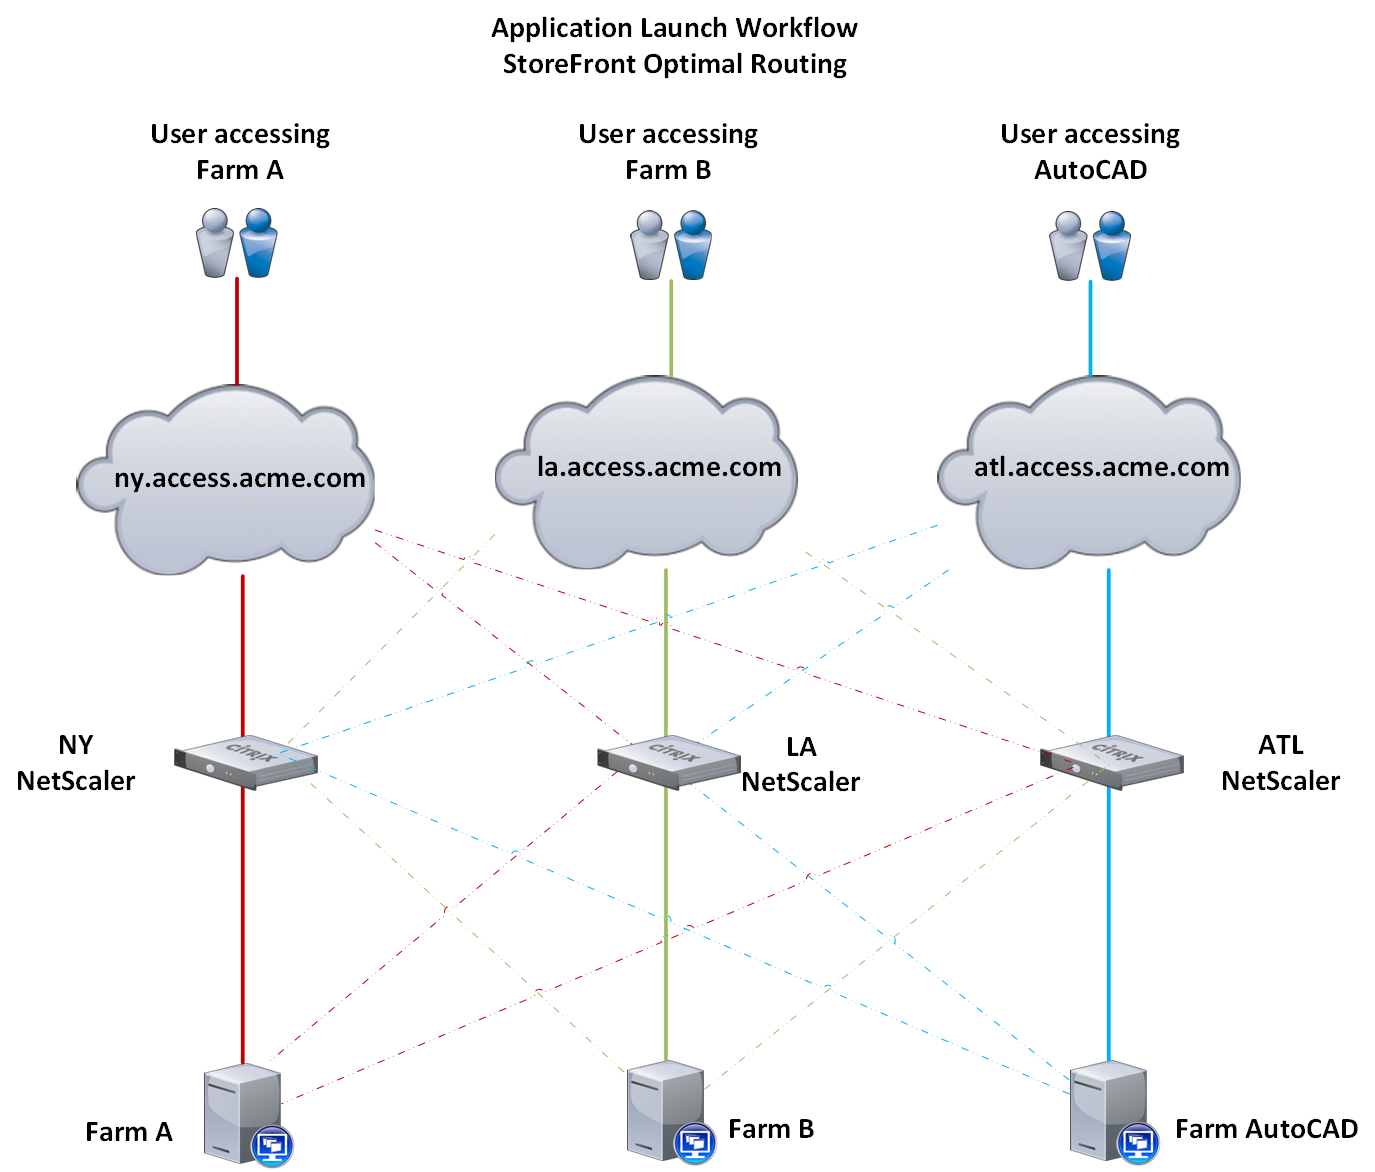
The diagram below illustrates the application launch workflow. The thick lines represent normal working conditions. The dotted lines represent the backup workflow in the event that site is experiencing an outage.   Blog_App_Launch_01   Thank you for reading. I hope you found this beneficial. Please let me know if you have questions in the comments below. BC  

Customize your monitoring with the XenDesktop Director API and Python

On a day-to-day basis I assist with the operations of a Citrix environment with 100+ individual XenDesktop sites (small offices). With Director, only a single site is visible at a time. I would have to select each site individually to find out if there are any failure events at a location. For 100+ sites this would be extremely tedious and time consuming. Wouldn’t it be great if there was a way to look through all unique sites and find out if there’s a failure? Heck yeah it would!

Our Solution

What I did was create a Python script that does just that. The script consumes a text file with a list of all of the XML Brokers and asks each broker “What is your current your failure count?”. If the failure count is greater than 0 (zero), which means there’s a failure, then open up IE and navigate to that site for further investigation. The way the script is written, it will iterate and re-iterate through the list until the script is manually stopped. This way I can leave it running all day and if there’s an issue IE will pop up prompting me to login, and pause for 30 seconds. Director-Logon   If no issues are found at the queried XML Broker, then the script will wait 5 seconds and move to the next XML Broker in the list. If you need to manually stop the script, then use CTRL+C or just close the window where the application is being executed. When an error is found, then I can logon on to the Director server and begin troubleshooting. Director-Error 
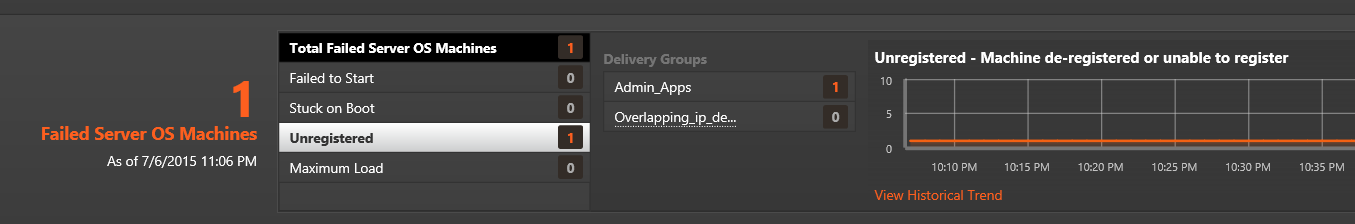
Each query is targeted at the URL “/Citrix/Monitor/OData/v2/Data/FailureLogSummaries”. The first XML tag is what the script is looking for because it contains the current failure count. For documentation on what information is contained in this field, please visit eDocs http://support.citrix.com/proddocs/topic/xendesktop-7/cds-ms-odata-wrapper.html. The location of the text file for me is “D:\temp\ddcFile.txt”. You may modify the variable “ddcFile” to your specific file location. The file lists DDC as such. ddc1.mycompany.net ddc2.mycompany.net ddc3.mycompany.net Here is the Python code is below.
import requests
import time
import xml.etree.ElementTree as ET
import requests.auth
from requests_ntlm import HttpNtlmAuth
import getpass
import webbrowser

#use this for username\password

username = raw_input("Enter Domain\\Username :")
password = getpass.getpass("Enter Password :")

#xml namespaces
ns = {'default': "http://www.w3.org/2005/Atom",
    'base': "http://192.168.0.112/Citrix/Monitor/OData/v2/Data/",
    'd': "http://schemas.microsoft.com/ado/2007/08/dataservices",
    'm': "http://schemas.microsoft.com/ado/2007/08/dataservices/metadata"}

#Used for automatically launching IE when a failure is detected.
ie = webbrowser.get(webbrowser.iexplore)

class DdcMonitor:
    def main(self):
        while True:
            #opens the file with the list of DDCs
            ddcFile = open('D:\\temp\\ddcFile.txt', 'r')
            for ddcFQDN in ddcFile:
                #uses HTTP. HTTPS could be added if needed.
                directorURL = "http://" + ddcFQDN.rstrip("\n") + "/Citrix/Monitor/OData/v2/Data/FailureLogSummaries"
                print("Now probing : " + str(directorURL))
                #Connection information
                #here is an example of a constructed query
                #directorURL = "http://192.168.0.112/Citrix/Monitor/OData/v2/Data/FailureLogSummaries"
                directorSession = requests.session()
                directorSession.auth = HttpNtlmAuth(username,password)
                directorReqData = directorSession.get(directorURL)

                #XML information
                root = ET.fromstring(directorReqData._content)
                entry = root.find('default:entry', ns)
                sub_1 = entry.find("default:content", ns)
                for sub_2 in sub_1.find("m:properties", ns):
                   if "FailureCount" in str(sub_2.tag):
                       if int(sub_2.text) > 0:
                           print("")
                           print("The Failure Count is increasing at " + directorURL)
                           print("The error count is currently :   " + sub_2.text)
                           print("Waiting 30 seconds")
                           ie.open('http://' + ddcFQDN + "/director")
                           print("")
                           time.sleep(30)
                       else:
                           print("The Failure Count is not increasing at " + directorURL)

                print("The probe will run again in 5 seconds")
                print("")
                print("")
                time.sleep(5)

            ddcFile.close()
            time.sleep(1)

try:
    DdcMonitor().main()
    print("the program is no longer running")
except:
    print("Something caused the program to stop. Please restart the program")
Is there any information that you would like to monitor from your Citrix deployment on an hourly, daily, or weekly basis? Let me know in the comments below. Thanks for reading! BC This software / sample code is provided to you “AS IS” with no representations, warranties or conditions of any kind. You may use, modify and distribute it at your own risk.

Troubleshooting Cryptic NetScaler “Internal Error” When Installing or Replacing a Certificate Key Pair

Abstract The purpose of this blog is to assist with troubleshooting the “Internal Error” error when installing or replacing certificate key pairs. Let’s dive in No matter how many times you click the “install” button the certificate key pair just will not install. Sound familiar? I’ve encounters this issue, many, many, many times. The root cause is always one of the following:
  1. The certificate or private key are formatted improperly.
  2. The certificate does not correspond to the correct private key.
Let’s go into each of these. 1. The certificate or private key are formatted improperly. Sometimes extra spaces can throw off the import of a certificate/key pair. Personally, I try to put all certificates into a PEM format. NetScaler OpenSSL can be used to accomplish this. For keys use the following command. Use the “–inform DER” option for DER encoded keys.

Openssl rsa –in -out

Along the same lines, use the following command to reformat the certificate file:

Openssl x509 –in -out

Try installing the certificate/key pair again. If that doesn’t work then… 2. The certificate does not correspond to the correct private key. I encounter this much more than people would think. If the certificate was generate from a CSR that was not signed by the correct private key, then the certificate will never install. Ever. How can we check if the certificate was generated from a CSR that was signed by the correct key? By checking the modulus of the private key, CSR, and certificate of course :-)! The modulus of the private key and certificate must be 100% exact matches. For an explanation as to why this is the case, please seehttps://en.wikipedia.org/wiki/RSA_(cryptosystem). To view the modulus of a private key, use the following command. Openssl rsa – modulus –noout –in To view the modulus of a csr:

Openssl req – modulus –noout –in

To view the modulus of a certificate:

Openssl x509 –modulus –noout –in

Below is a sample output for what the modulus will look like for my public certificate. NetScaler_modulus FIPS NetScaler Appliances 
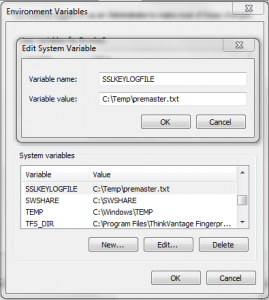
So what happens if you can’t access your private key to run OpenSSL commands (FIPS NetScaler appliances)? Remember that the Key, CSR, and Cert MUST all use the same modulus if they are related. With this theory in mind, you can generate a bogus CSR off of the FIPS key to see what the modulus should be for the public certificate. If you generate a CSR off of a FIPS box and the modulus for that CSR does not match the modulus for the Public Certificate that was returned to you, then that certificate did not use a CSR that was generated off of that FIPS key. I hope this information has helped. The OpenSSL commands I have listed are only a handful of my favorites. For a really good cheat sheet on useful commands (I have it bookmarked), check out the link below. https://www.sslshopper.com/article-most-common-openssl-commands.html Let me know if you have questions in the comments below! BC

Prevent a DOS via user lockouts at NetScaler Gateway

Before we begin let me first say… All NetScaler Gateway landing page customizations are unsupported. Changing the NetScaler Gateway landing page will cause you to have an unsupported environment. I do not condone malicious attempts to lockout user accounts. The purpose of this article is to highlight a current risk and mitigation steps. Now that the disclaimer is out of the way. Let’s start with the customizations :-). The current recommended configuration for two-factor authentication at NetScaler is available here. http://support.citrix.com/article/CTX125364 With the configuration highlighted in the article above. Web based users that authenticate are hitting AD first. Ideally, we would want to follow the authentication workflow that is configured for the Native Receiver. The Native Receiver evaluates RADIUS first, and if this is successful, then the LDAP policy is invoked. What is the risk of leaving the configuration exactly how the article has outlined the configuration? If Bob, a malicious user, knows Alice’s username, then Bob could enter a bogus password 3 times and lock Alice’s account. Bob could do this as often as he liked until some measure went into place to stop Bob. If Bob knew a lot of usernames and had some knowledge of scripting tools such as JMeter, then he could lockout a large number of user accounts effectively acting as a DOS. This would be bad, and I again, I would not condone such an attack.  So what can we do to mitigate such a risk? The quick and easy way to do it is to reverse the web authentication policies so that they match up with the Native Receiver (RADIUS as primary, LDAP as secondary). However, this will force users to enter their RADIUS passcode before entering their AD username. Most organizations want to have the dynamic pin as the 2nd password for users to enter. So how can we mitigate the risk AND have the dynamic token as the second password users need to enter? Like in the quick and easy method, we would need to make the RADIUS authentication primary and the LDAP authentication secondary. Now we need to customize some JavaScript on the NetScaler. The file /vpn/login.js is what we need to customize. This file can be found under“/netscaler/ns_gui/vpn/login.js”. What we will do is change the ordering of the POST values. The JavaScript below has the original values in red that we will change.
function ns_showpwd_default() { var pwc = ns_getcookie(“pwcount”); document.write(‘’ + _(“Password”)); if ( pwc == 2 ) { document.write(‘ 1′); } document.write(‘:’); document.write(‘passwd” size=”30″ maxlength=”127″ style=”width:100%;”>’); if ( pwc == 2 ) { document.write(‘’ + _(“Password2″) + ‘ passwd1” size=”30″ maxlength=”127″ style=”width:100%;”>’); } UnsetCookie(“pwcount”); }
  The JavaScript below contains the revised fields so that when a user POSTs their credentials, NetScaler will can evaluate RADIUS before attempting to contact AD. The values passwd1 andpasswd are swapped.  
  function ns_showpwd_default() { var pwc = ns_getcookie(“pwcount”); document.write(‘’ + _(“Password”)); if ( pwc == 2 ) { document.write(‘ 1′); } document.write(‘:’); document.write(‘passwd1” size=”30″ maxlength=”127″ style=”width:100%;”>’); if ( pwc == 2 ) { document.write(‘’ + _(“Password2″) + ‘ passwd” size=”30″ maxlength=”127″ style=”width:100%;”>’); } UnsetCookie(“pwcount”); }
With this configuration, we can remove an avenue for would-be attackers who intend to lockout users. Also, below are some relevant links for NetScaler Gateway customizations. http://support.citrix.com/article/CTX125364 http://support.citrix.com/article/CTX126206 http://support.citrix.com/proddocs/topic/netscaler-gateway-101/ng-connect-custom-theme-page-tsk.html Have you worked at an organization that has come under attack from user lockouts? What have you done to mitigate the threat? Let me know in the comments below and feel free to ask questions! Thanks for reading, BC

A Different Approach to a Single FQDN for StoreFront and NetScaler Gateway

The purpose of this post is to show how users can be educated to use a single URL, while still using having a StoreFront base URL that is different from the NetScaler Gateway URL. Please keep in mind this solution works best for Receiver for Web. This solution does work with the Native Receiver, but the Provisioning file would be the easiest way to configure the Native Receiver in my opinion. For this scenario, I will use connect.example.com for external access to the Citrix environment. Int-connect.example.com will be used for internal access to the Citrix environment. Below are overview of the requirements for the scenario to get us started. 1. SAN certificate for int-connect.example.com and connect.example.com. 2. Connect.example.com will resolve to the publicly accessible NetScaler Gateway VIPs. 3. Int-connect.example.com will resolve to the internal StoreFront Load Balanced VIPs. 4. CNAME on the internal DNS. connect.example.com –> int-connect.example.com. 5. Responder Policy to redirect from int-connect.example.com to connect.example.com. Now for the magic of creating the single FQDN that users need to know. In this example, the “single URL” for users is connect.example.com. On the internal DNS infrastructure, create a CNAME for connect.example.com to point to int-connect.example.com. Then, on the NetScaler appliance, create a Responder Policy that redirects traffic with the HTTP Hosts header of “connect.example.com” to “int-connect.example.com”. Bind this policy to the StoreFront LB VIP on NetScaler. So what is the expected user behavior? A user on the internal network types connect.example.com into their browser. Connect.example.com resolves as a CNAME for int-connect.example.com. The user will resolve int-connect.example.com. After obtaining the IP address for int-connect.example.com, the user connects to the SF LB VIP using the IP address and the HTTP host header connect.example.com. The Responder policy redirects the user to int-connect.example.com. The user’s browser follows the redirect and is able to access the StoreFront LB VIP. By using a SAN certificate with the names we need, the user will not receive a certificate warning.   single_FQDN_with_NetScaler_blog_01_diagram 
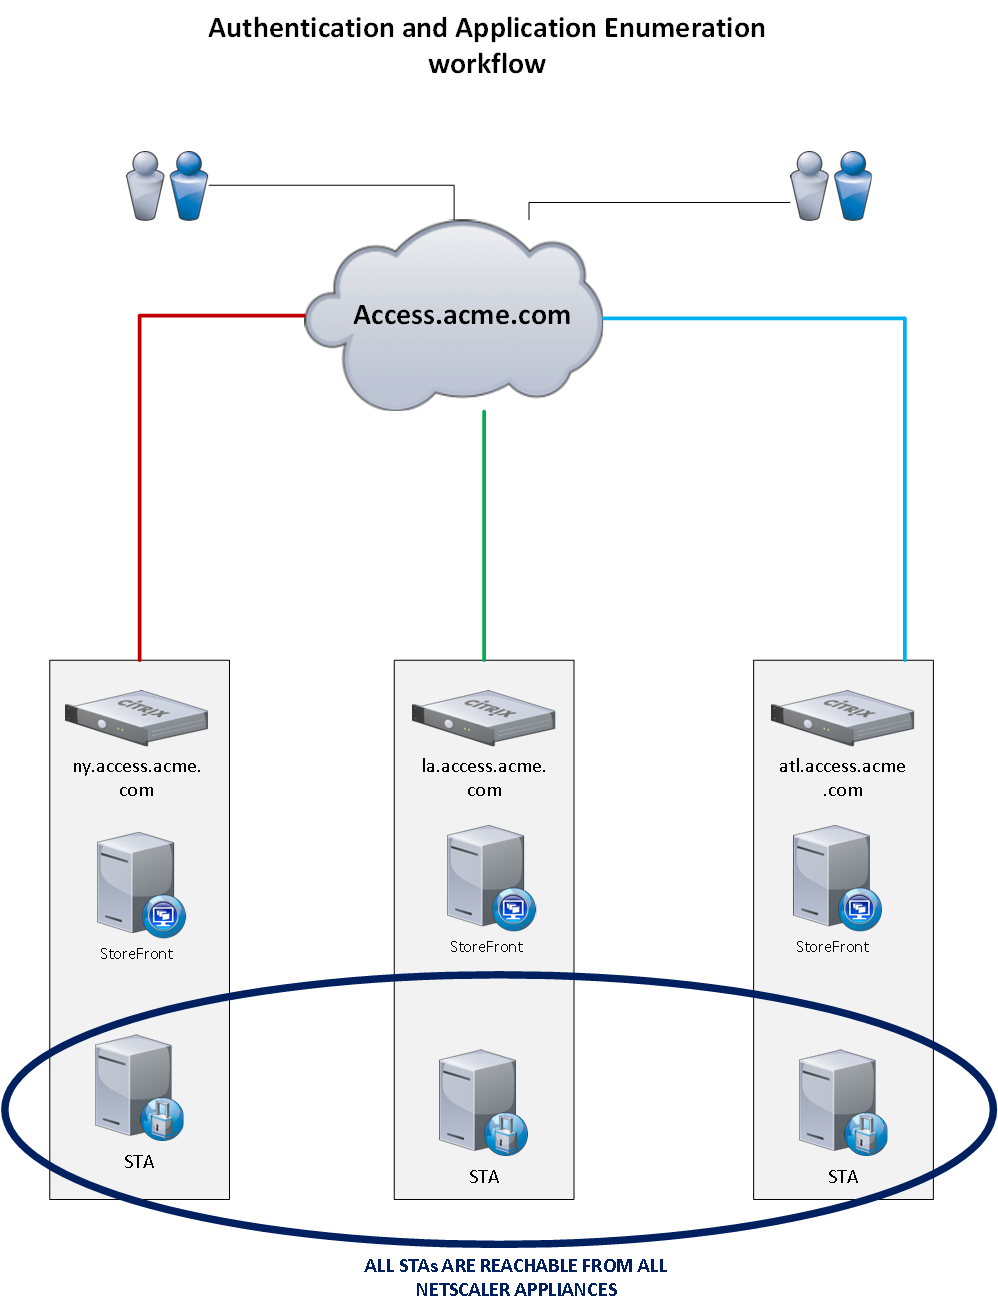
The workflow above is all seamless to the user. From their perspective, they type connect.example.com, and that takes them to the resources they need to focus on their job. Please keep in mind that this workflow is unique to Receiver for Web. Users that manually configure Receiver on the internal network will need to type out “int-connect.example.com” to connect to the StoreFront VIP and avoid a redirect. Again, I recommend using the provisioning file from StoreFront to configure the Native Receiver. Let me know if you have questions in the comments below! BC