Saturday, September 15, 2018

How to use Mitmproxy and Ettercap together on OS X El Capitan

Abstract.

The purpose of this document is to provide guidance on how to configure both of the tools mitmproxy and ettercap to work together to monitor mobile application traffic. This document is intended for educational purposes. Using the techniques here with malicious intent may result in criminal consequences. Before going any further, I want to  point out one of the better quotes that I have seen in a man file :-). Below can be found in the man file of ettercap.

"Programming  today  is  a  race between software engineers striving to build bigger and better idiot-proof programs, and the Universe trying to produce bigger and better idiots. So far, the Universe is winning." - Rich Cook

Install ettercap

Homebrew is amazing. Ettercap is as easy to install as issuing the following command.

brew install ettercap

Install mitmproxy

The docs for mitmproxy are fairly straightforward. Mitmproxy is a python package that runs on Python 2.7. The link below has the official documentation. http://docs.mitmproxy.org/en/latest/install.html#installation-on-mac-os-x

Configure Port Forwarding

First enable IP forwarding. This is outlined in the transparent proxy guide in the following link,. http://docs.mitmproxy.org/en/latest/transparent/osx.html.

sudo sysctl -w net.inet.ip.forwarding=1

Brian John does an excellent job explaining the new port configuration that needs to occur for OS X Mountain Lion. See the link below for his guide. http://blog.brianjohn.com/forwarding-ports-in-os-x-el-capitan.html I will go through the steps necessary for mitmproxy to work as expected based on the information that Brian John provided.

Create the anchor file.

/etc/pf.anchors/mitm.pf

Add the following lines to the anchor file, mitm.pf.

rdr pass on en0 inet proto tcp from any to any port 80 -> 127.0.0.1 port 8080

rdr pass on en0 inet proto tcp from any to any port 443 -> 127.0.0.1 port 8080

Create the pfctl config file.

/etc/pf-mitm.conf

Add the following lines to the pfctl config file.

rdr-anchor "forwarding" load anchor "forwarding" from "/etc/pf.anchors/mitm.pf"

Enable or Disable Port Forwarding.

To activate or deactivate port forwarding, use one of the following commands.

Enable.

sudo pfctl -ef /etc/pf-mitm.conf

Disable.

sudo pfctl -df /etc/pf-mitm.conf

Combining the tools.

Now that port forwarding is now configured, fire up mitmproxy with the following command.

python2.7 mitmproxy -T --host

mitmproxy will by default listen for incoming HTTP and HTTPS traffic on the proxy port 8080. Next, use the following command to start ARP spoofing the target device.

sudo ettercap -T -M arp:remote ///80,443/ ////

The final command should look something like the following.

sudo ettercap -T -M arp:remote /192.168.0.1//80,443/ /192.168.1.54///

You will need to trust the mitmproxy CA if you would like to inspect HTTPS traffic. The steps for this configuration can be found in the following link, http://docs.mitmproxy.org/en/latest/certinstall.html.   Once mitmproxy and ettercap are both running, then you should be start seeing network traffic from your mobile device on your OS X device. Good Luck with inspecting traffic! Let us know in the comments below if you have any questions or feedback on this article. Brooks  

No Private Key, No Problem. How to Decrypt SSL/TLS traffic with Session Keys.

The purpose of the paper is to provide a guide on how to decrypt SSL/TLS traffic without a private key.

There are many times when IT admins need to utilize a packet inspection such as Wireshark. When the application data is encrypted however, troubleshooting application data becomes more of a challenge. The easiest way to decrypt data is to use the private key for the corresponding public key. Wireshark provides another means for decrypting data as well by using the pre-master secret. I will not dive into the intricacies of why this can be used to decrypt data because that part of cryptology is an entirely separate topic. For an in-depth explanation see http://www.moserware.com/2009/06/first-few-milliseconds-of-https.html. Now let’s dive in.

Step 1.

The first thing you will need to do is configure an environment variable (Windows 7). Right click on My Computer –> Properties –> Advanced System Settings. In the Advanced Tab click Environment Variables.

wiresharkdecrypt_01  

Step 2.

Under the System variables, click New. You will add the System variable SSLKEYLOGFILE. Create a path from the variable ending with premaster.txt. See the image below for more details.

wiresharkdecrypt_02

Step 3.

Once this is set, we will point Wireshark to the premaster file by navigating to Edit –> Preferences –> Protocols –>SSL(Pre)-Master-Secret log filename. Click browse and select the premaster.txt file we created earlier. You will need to generate some encrypted traffic via Firefox or Chrome before the file will show up. Internet Explorer will not work for decrypting data using this method.

  wiresharkdecrypt_03

Step 4.

Any new network traces taken through Wireshark while navigating SSL/TLS encrypted sites that leverage a premaster secret and RSA will now be decrypted. A trace can also be taken from a NetScaler appliance, and then decrypted for a specific client utilizing the SSLKEYLOGFILE Environment Variable. For information on sharing a trace without distributing a private key, please see http://support.citrix.com/article/CTX135889.

wiresharkdecrypt_04

I’d like to give special credit to the author of the article below for inspiring this article.

http://www.root9.net/2012/11/ssl-decryption-with-wireshark-private.html

Happy Decrypting!

BC

Resilient Storefront Optimal Gateway Routing with GSLB

Pre-Requisites Before reading further, if you don’t know what StoreFront Optimal Gateway Routing (OGR) is, STOP and check out: If you need a refresher on DNS or NetScaler GSLB, then STOP and review eDocs and relevant CTX article and resources. For information on NetScaler GSLB, see the links below: And if you want to see how DNS works in your own environment, then check out one of my favorite ways to tools to troubleshoot and learn about DNS with http://digwebinterface.com/. Try resolving your own site with the “trace” option checked and unchecked. Abstract The purpose of this blog is provide an overview on how GSLB can be used to provide a redundant solution with StoreFront Optimal Gateway Routing (OGR). A few questions will be answered in this blog for a multi-datacenter design.
  1. How can we use a single URL for external access?
  2. How can we send users to specific datacenter where users’ unique data or backend application dependencies reside?
  3. How can we deploy a resilient solution to protect against a datacenter outage?
Let’s get into it Acme is our example customer. Acme has three (3) datacenters, NY, LA, and Atlanta (ATL). User’s on the East coast have non-persistent desktops, but have their roaming profile on a file server at NY. User’s on the West coast have non-persistent desktops, but have their roaming profile on a file server at LA. All users have access to a unique application that has backend requirements at the ATL datacenter. So the answer to question number one is fairly straight forward. Use GSLB with NetScaler Gateway. The common external FQDN can be “access.acme.com”. Three (3) NetScaler Gateway VIPs will reside at each datacenter and will be included in the GSLB configuration. If we didn’t care where we sent users, then we could stop here. However, with the scenario outlined above, we want to avoid scenario where a NY user (user data is in NY) launches a desktop that is proxied by the LA Datacenter. This user would then have their Citrix session go from client’s locations –> LA NetScaler Gateway –> NY datacenter, which is certainly not the optimal route. More importantly this routing will utilize precious private site-to-site bandwidth and could be detrimental to a user’s experience. This is where OGR comes into play. Let’s answer question #2. How can we send users to a specific datacenter where their unique data or backend application dependencies reside? We want to use site prefixes to make each site unique. For those of you already thinking ahead, yes, a SAN certificate is required for this solution. Below are the prefixes we will use for the example:
  • NY NetScaler Gateway VIP = ny.access.acme.com
  • LA NetScaler Gateway VIP = la.access.acme.com
  • ATL NetScaler Gateway VIP = atl.access.acme.com
With OGR and under normal work conditions we can direct users accessing a XD Site at NY will be proxied by the NY NSG (ny.access.acme.com), users accessing a XD Site at LA will be proxied by the LA NSG (la.access.acme.com), and users accessing the unique application (AutoCAD) will be proxied by the ATL NSG (atl.access.acme.com). With this solution, users are able to authenticate at any site and launch applications that will utilize the public WAN to cross the nation, instead of using potentially costly MPLS connections. How are users able to authenticate at NY, but still able to launch apps from ATL? Using STAs of course! All NetScaler appliances in the environment will need to be able to communicate with all of the same STAs. For information on STAs, please see: http://support.citrix.com/article/CTX101997. With this configuration, authentication and application enumeration are separate events from application launch. It is key to understand that fact. Authentication can occur anywhere, but application launch is more granularly specified with unique site prefixes and OGR. So let’s answer question # 3 and add some resiliency. How can we deploy a resilient solution to protect against a datacenter internet outage? What happens when a construction company’s backhoe accidently severs Acme’s internet POP in LA while laying down city infrastructure, but Acme’s MPLS connection remains intact? A unique GSLB vServer exists for each of the site unique prefixes. A separate GSLB vServer also exists for “access.acme.com”. Configuring the “access.acme.com” vServer as a backup vServer for all of the GSLB vServers with the site prefix will protect the individual and unique FQDNs against a datacenter failure. For example, when the LA datacenter’s internet connection is broken, the NetScaler appliances at NY and ATL will recognize an outage via either MEP or explicit health monitors. Users are then sent to the available NY and ATL NSG when resolving “la.access.acme.com” and “access.acme.com”. Users can then be proxied through the internal MPLS via the available sites. If the MPLS (or other private site to site connection) went down, then StoreFront can be configured with DR (http://support.citrix.com/proddocs/topic/dws-storefront-26/dws-configure-ha-lb.html), but we will save that talk for another day ;-). I have included some diagrams to help clarify things. A key things to keep in mind is that authentication and application launch are two completely separate events and workflow. The diagram below is for the authentication and application enumeration workflow.   Blog_Auth_Workflow_01   
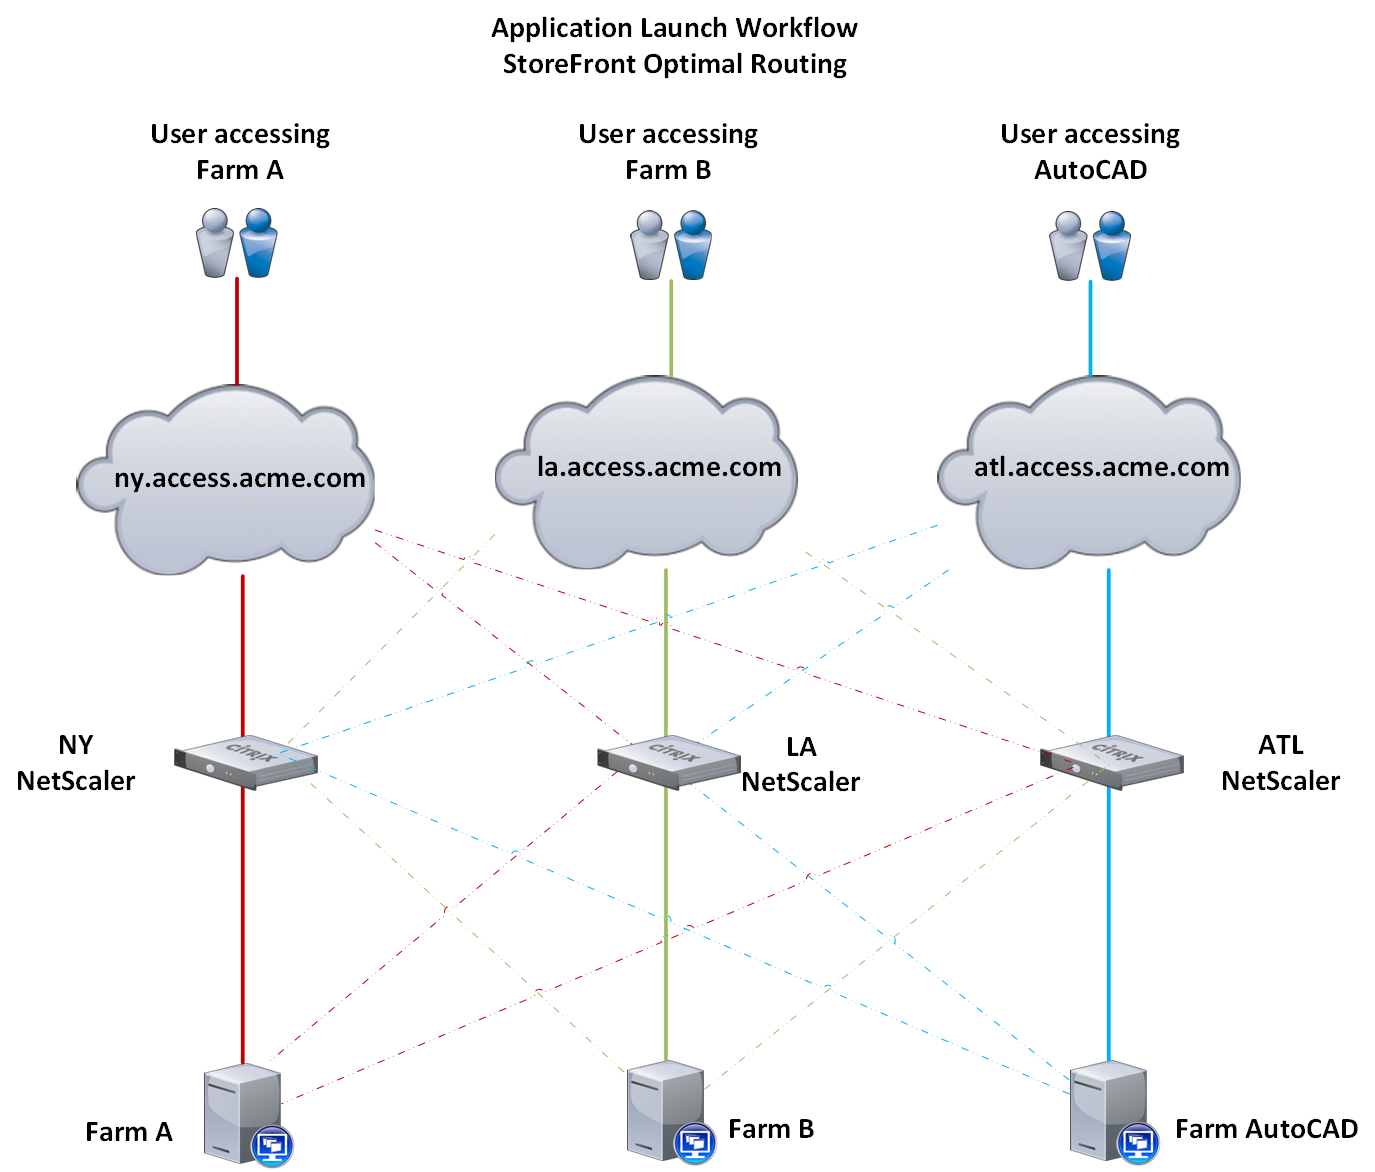
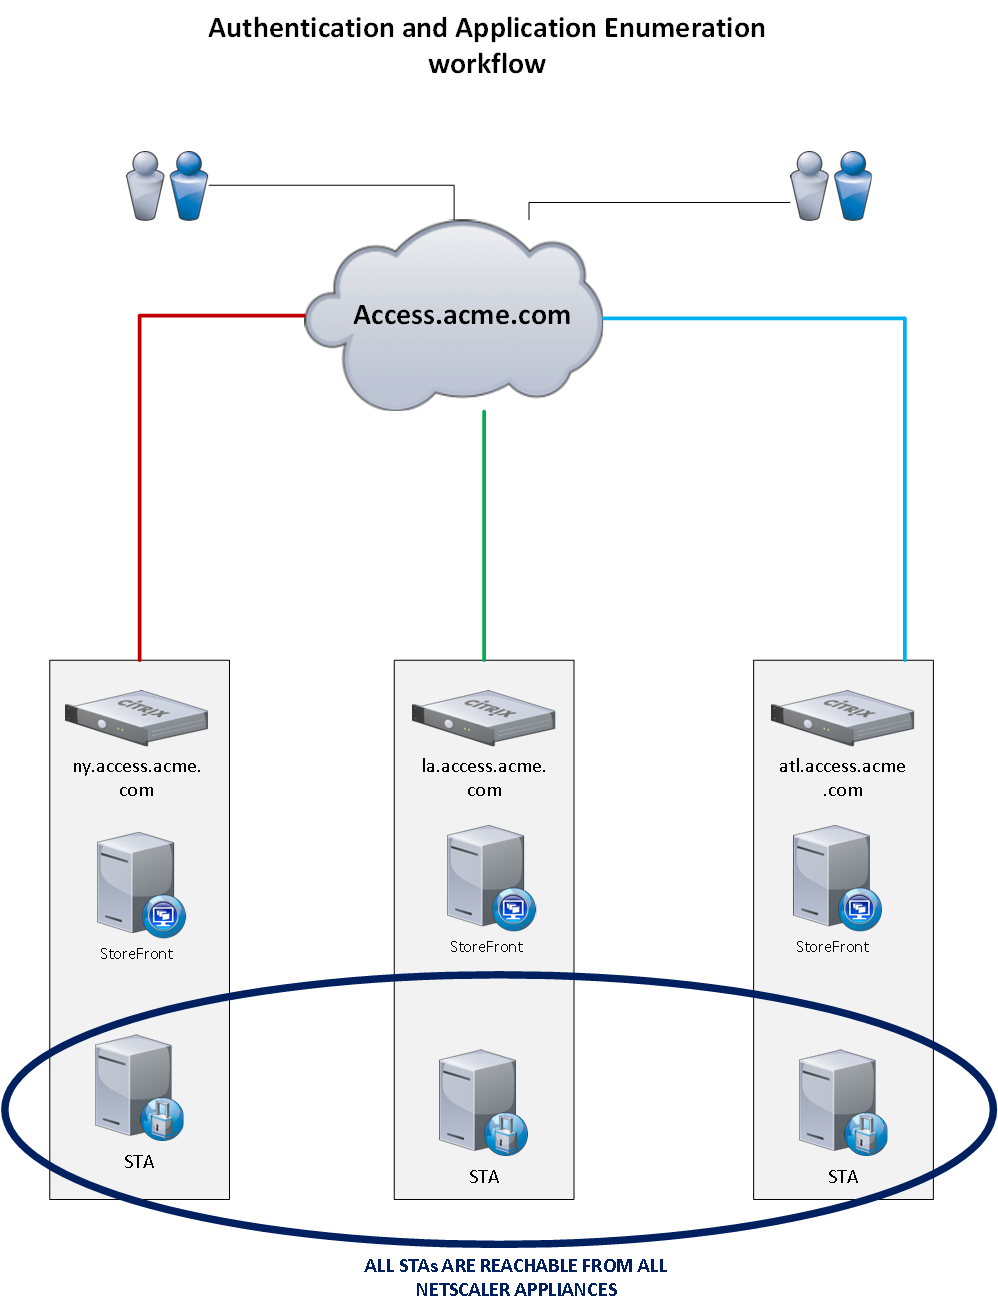
The diagram below illustrates the application launch workflow. The thick lines represent normal working conditions. The dotted lines represent the backup workflow in the event that site is experiencing an outage.   Blog_App_Launch_01   Thank you for reading. I hope you found this beneficial. Please let me know if you have questions in the comments below. BC  

Customize your monitoring with the XenDesktop Director API and Python

On a day-to-day basis I assist with the operations of a Citrix environment with 100+ individual XenDesktop sites (small offices). With Director, only a single site is visible at a time. I would have to select each site individually to find out if there are any failure events at a location. For 100+ sites this would be extremely tedious and time consuming. Wouldn’t it be great if there was a way to look through all unique sites and find out if there’s a failure? Heck yeah it would!

Our Solution

What I did was create a Python script that does just that. The script consumes a text file with a list of all of the XML Brokers and asks each broker “What is your current your failure count?”. If the failure count is greater than 0 (zero), which means there’s a failure, then open up IE and navigate to that site for further investigation. The way the script is written, it will iterate and re-iterate through the list until the script is manually stopped. This way I can leave it running all day and if there’s an issue IE will pop up prompting me to login, and pause for 30 seconds. Director-Logon   If no issues are found at the queried XML Broker, then the script will wait 5 seconds and move to the next XML Broker in the list. If you need to manually stop the script, then use CTRL+C or just close the window where the application is being executed. When an error is found, then I can logon on to the Director server and begin troubleshooting. Director-Error 
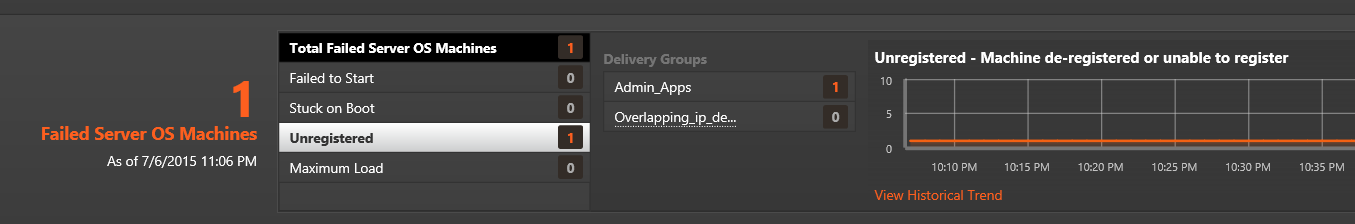
Each query is targeted at the URL “/Citrix/Monitor/OData/v2/Data/FailureLogSummaries”. The first XML tag is what the script is looking for because it contains the current failure count. For documentation on what information is contained in this field, please visit eDocs http://support.citrix.com/proddocs/topic/xendesktop-7/cds-ms-odata-wrapper.html. The location of the text file for me is “D:\temp\ddcFile.txt”. You may modify the variable “ddcFile” to your specific file location. The file lists DDC as such. ddc1.mycompany.net ddc2.mycompany.net ddc3.mycompany.net Here is the Python code is below.
import requests
import time
import xml.etree.ElementTree as ET
import requests.auth
from requests_ntlm import HttpNtlmAuth
import getpass
import webbrowser

#use this for username\password

username = raw_input("Enter Domain\\Username :")
password = getpass.getpass("Enter Password :")

#xml namespaces
ns = {'default': "http://www.w3.org/2005/Atom",
    'base': "http://192.168.0.112/Citrix/Monitor/OData/v2/Data/",
    'd': "http://schemas.microsoft.com/ado/2007/08/dataservices",
    'm': "http://schemas.microsoft.com/ado/2007/08/dataservices/metadata"}

#Used for automatically launching IE when a failure is detected.
ie = webbrowser.get(webbrowser.iexplore)

class DdcMonitor:
    def main(self):
        while True:
            #opens the file with the list of DDCs
            ddcFile = open('D:\\temp\\ddcFile.txt', 'r')
            for ddcFQDN in ddcFile:
                #uses HTTP. HTTPS could be added if needed.
                directorURL = "http://" + ddcFQDN.rstrip("\n") + "/Citrix/Monitor/OData/v2/Data/FailureLogSummaries"
                print("Now probing : " + str(directorURL))
                #Connection information
                #here is an example of a constructed query
                #directorURL = "http://192.168.0.112/Citrix/Monitor/OData/v2/Data/FailureLogSummaries"
                directorSession = requests.session()
                directorSession.auth = HttpNtlmAuth(username,password)
                directorReqData = directorSession.get(directorURL)

                #XML information
                root = ET.fromstring(directorReqData._content)
                entry = root.find('default:entry', ns)
                sub_1 = entry.find("default:content", ns)
                for sub_2 in sub_1.find("m:properties", ns):
                   if "FailureCount" in str(sub_2.tag):
                       if int(sub_2.text) > 0:
                           print("")
                           print("The Failure Count is increasing at " + directorURL)
                           print("The error count is currently :   " + sub_2.text)
                           print("Waiting 30 seconds")
                           ie.open('http://' + ddcFQDN + "/director")
                           print("")
                           time.sleep(30)
                       else:
                           print("The Failure Count is not increasing at " + directorURL)

                print("The probe will run again in 5 seconds")
                print("")
                print("")
                time.sleep(5)

            ddcFile.close()
            time.sleep(1)

try:
    DdcMonitor().main()
    print("the program is no longer running")
except:
    print("Something caused the program to stop. Please restart the program")
Is there any information that you would like to monitor from your Citrix deployment on an hourly, daily, or weekly basis? Let me know in the comments below. Thanks for reading! BC This software / sample code is provided to you “AS IS” with no representations, warranties or conditions of any kind. You may use, modify and distribute it at your own risk.